Pie chart makerPie chart Maker

  • Line Graph
  • Bar Graph
  • Doughnut Chart
  • Scatter Chart
  • Essay-Grader.ai
  • DesignerrAI
  • RBT Practice Test
☰
History of Pie charts

History of Pie charts

The concept of a pie chart, or a circular graphical representation of data, has been around for centuries. The earliest known use of a pie chart can be traced back to the 17th century, when...

When to use a Pie chart?

When to use a Pie chart?

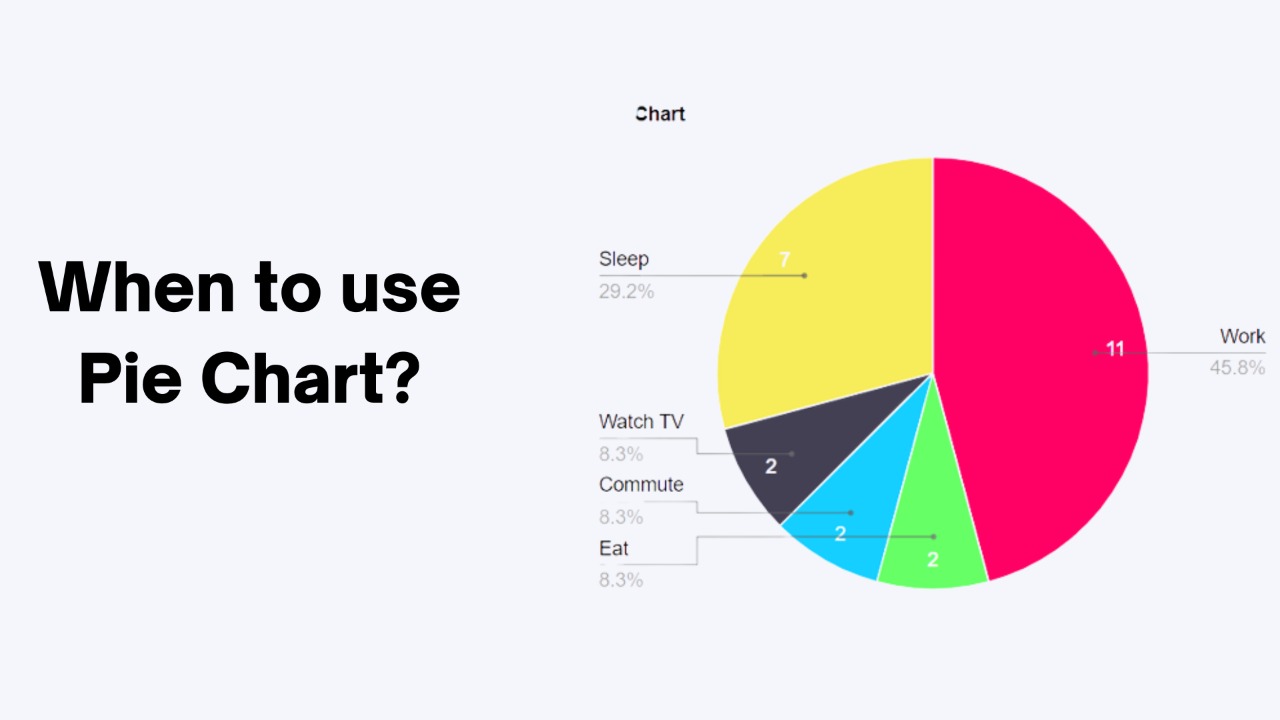
Pie charts are best used when you want to compare the proportions or percentages of different categories within a data set. For example, a pie chart could be used to ...

When to use a Pie chart vs a Bar graph?

When to use a Pie chart vs a Bar graph?

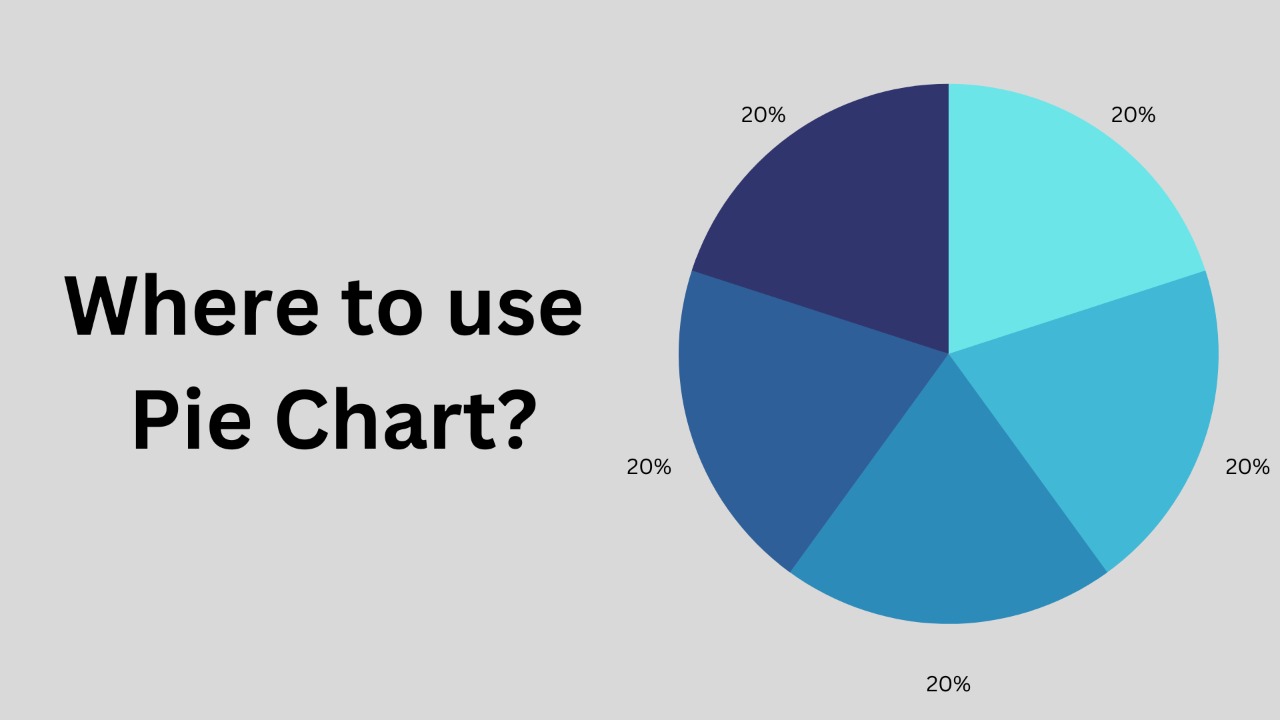
Pie charts and bar graphs are two different types of visualizations that are used to represent data. While both can be useful for showing the proportions ...

Where Pie charts are used?

Where Pie charts are used?

A pie chart is a graphical representation of data that uses slices of a circle to show the relative sizes of the data. Each slice represents a category of the data, and the size of the slice ...

Which data would be suitable for a Pie chart?

Which data would be suitable for a Pie chart?

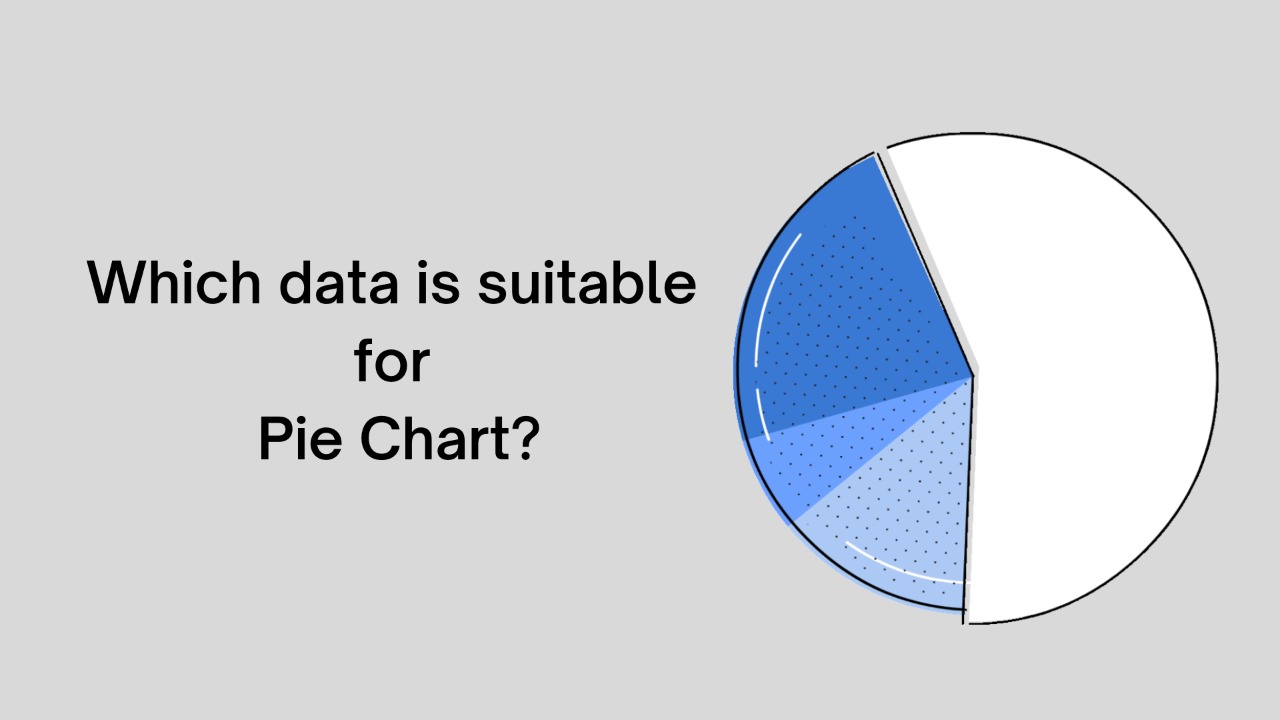
Data that shows the proportions or percentages of different categories within a set would be suitable for a pie chart. For example, if you have data ...

Pie Chart MakerPie Chart Maker

© 2025

  • About
  • Contact
  • Blogs
  • Privacy policy
  • Terms and Conditions
  • Disclaimer
  • Line graph maker
  • Bar graph maker
  • Doughnut Chart Maker
  • Scatter Chart Maker
  • Other Tools
  • Essay-Grader.ai
  • QuestionAI.io
  • Sober Homes Near Me
  • Blox Fruits Values
  • DesignerrAI
  • RBT Practice Test

We may receive a commission or other compensation from the links on this website.